To find collection gaps in medical billing, you must move beyond just checking your bank deposits. The key is systematically analyzing specific reports primarily your Aging Accounts Receivable (A/R) Report, Denial Management Report, and Payment Variance Report. By drilling into these reports weekly, you can identify patterns: which payers deny most often, which codes are consistently underpaid, and which claims are languishing unpaid. This data-driven approach transforms random follow-up into a targeted strategy, plugging revenue leaks and often increasing collections by 15-30%.
The Silent Revenue Bleed You Can’t Afford to Ignore
Did you know that the average medical practice loses between 10-15% of its potential revenue to collection gaps it never even sees? This isn’t about a single denied claim; it’s a death by a thousand paper cuts small, systematic leaks in your billing process that drain your practice’s financial vitality. As a practice administrator or billing professional, you might feel you’re constantly “working the A/R,” but without a forensic approach to your reports, you’re likely chasing the symptoms, not the disease. This guide is not theoretical. It’s the exact, battle-tested framework our consulting team uses to help practices like yours identify and plug these leaks, recover significant lost revenue, and build a bulletproof financial workflow. By the end, you’ll have a clear, 7-step action plan to turn your billing reports from confusing spreadsheets into a powerful revenue recovery engine.
The Mindset Shift: From Reactive Billing to Proactive Revenue Intelligence
Before we dive into the reports, you must adopt a new mindset. Most billing teams are reactive: they work denials as they appear and call on old accounts. A proactive team uses reports predictively to prevent denials and underpayments before they happen.
Micro-Story: Dr. Evans’ three-provider practice was “breaking even,” but something felt off. They paid their bills, but there was never money for new equipment or bonuses. They assumed it was “just the market.” A deep dive into their payment variance report revealed they had been systematically underpaid by their top payer for a specific, high-value procedure for over 18 months. The “small” $45 underpayment per claim, across hundreds of claims, totaled over $68,000 in lost revenue. They never looked at reports that way before. They filed a corrected claim batch and recovered a significant portion. This wasn’t a market problem; it was a reporting problem.
The 3 Essential Reports for Uncovering Collection Gaps
Your practice management (PM) system is a goldmine of data. These three reports are your primary tools for excavation.
1. The Aging Accounts Receivable (A/R) Report: Your Financial Pulse Check
This is the most common report, but few use it to its full potential. It’s not just a list of who owes you money; it’s a story about your revenue cycle’s health.
- What it is: A snapshot of all outstanding claims, categorized by their age (e.g., 0-30 days, 31-60 days, 61-90 days, 90+ days).
- How to Use It to Find Gaps:
- Gap: Stagnant Claims. A claim sitting in the 31-60 day bucket is a red flag. It hasn’t been paid quickly, and it hasn’t been denied. It’s in limbo. This often indicates a need for follow-up that hasn’t happened.
- Gap: The “A/R Over 90 Days” Black Hole. Industry standard shows that the likelihood of collecting on a claim over 90 days old drops below 70%. A large balance here indicates a severe process breakdown.
- Actionable Analysis: Don’t just look at the total dollar amounts. Calculate the percentage of A/R in each bucket. A healthy A/R has 75-80% in the 0-30 day bucket. If your 31-60 day bucket is growing, it’s a leading indicator of future cash flow problems.
Example: Your A/R report shows:
- 0-30 Days: $50,000 (50%)
- 31-60 Days: $30,000 (30%)
- 61-90 Days: $15,000 (15%)
- 90+ Days: $5,000 (5%)
This is a major red flag. Half your money is already outside the “prompt pay” window. The gap here is a lack of aggressive follow-up on claims as soon as they hit the 31-day mark.
2. The Denial Management Report: Your Blueprint for Prevention
Denials are the most obvious collection gap, but managing them individually is a losing game. The report is where you find patterns.
- What it is: A report detailing all claims that were rejected or denied by payers, along with the stated reason codes.
- How to Use It to Find Gaps:
- Gap: Repetitive Denials. Are you seeing the same denial reason, like “eligibility,” week after week? The gap isn’t the denial itself; it’s the front-office process of verifying eligibility that’s broken.
- Gap: Payer-Specific Issues. Is one particular payer responsible for 40% of your denials? The gap is your lack of a tailored, proactive approach to that payer’s unique rules.
- Actionable Analysis: Use a Pivot Table to sort denials by Reason Code and Payer. This will immediately show you your top 3 denial reasons and your most problematic payers. This data allows you to move from “fighting fires” to “installing smoke alarms.”
Case Study: A cardiology group was plagued by “Authorization Missing” denials. Their denial report showed it was happening almost exclusively with two specific CPT codes for echocardiograms. Instead of just re-submitting the auths, they investigated. They discovered their new patient registration team was using an outdated pre-authorization matrix given to them by the payers. Updating that one document and retraining the team reduced these denials by 90% within one month.
3. The Payment Variance / Expected vs. Actual Report: The Hidden Goldmine
This is the most underutilized and powerful report for finding the most insidious collection gaps—underpayments.
- What it is: A report that compares the payment you expected (based on your fee schedule and contracted rates) to the payment you actually received from the payer.
- How to Use It to Find Gaps:
- Gap: Contractual Non-Compliance. This report directly shows when a payer has not paid you according to your contract. This could be a simple error, a misinterpretation of a code’s fee, or a deliberate underpayment hoping you won’t notice.
- Gap: Fee Schedule Inaccuracy. If you’re consistently underpaid across multiple payers for the same code, the gap might be that your PM system’s expected fee schedule is incorrect.
- Actionable Analysis: Run this report for all paid claims weekly. Filter for any payment that is more than a 5% variance from your expected amount. Investigate each one. Was it a contractual write-off you missed? A patient co-pay? Or was it a true underpayment that requires an appeal?
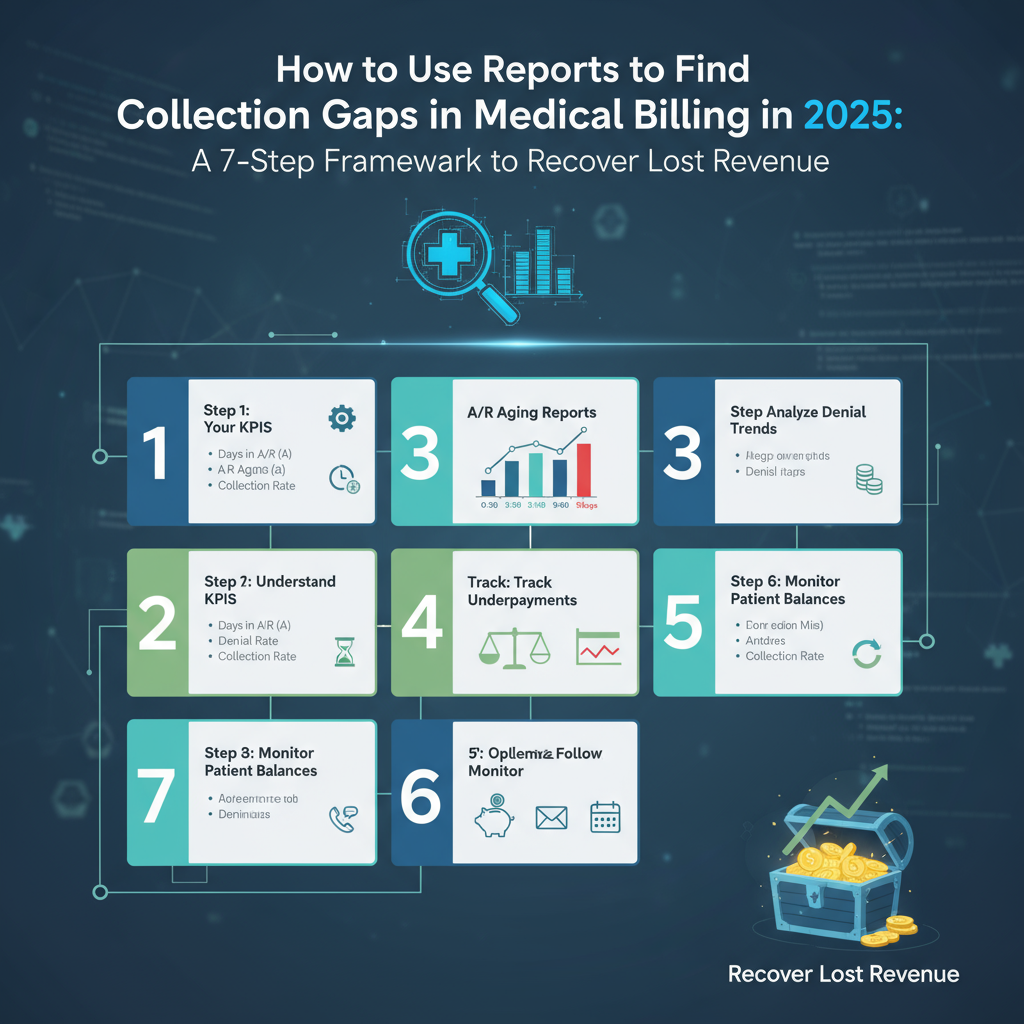
The 7-Step Actionable Framework to Find and Fix Collection Gaps
Here is your step-by-step, practical plan. Implement this weekly.
Step 1: Run the “Holy Trinity” Reports Weekly
Every Monday, generate your Aging A/R, Denial Management, and Payment Variance reports. Consistency is key.
Step 2: Triage with the A/R Report
Focus your immediate energy on the 31-60 day bucket. These are your “at-risk” claims. Assign a staff member to contact these payers for status updates this week. Prevent them from sliding into the 61-90 day black hole.
Step 3: Conduct a Denial Autopsy
Take your top 3 denial reason codes from the Denial Management Report. For each, ask “Why?” five times.
- Denial: “Eligibility.”
- Why? The patient’s coverage was inactive.
- Why? The front desk didn’t verify it correctly.
- Why? They checked the day before, but the patient lost coverage overnight.
- Why? Our process is to verify 24 hours in advance. We need a real-time check on the day of service.
- Solution: Implement a real-time eligibility check on the morning of the appointment.
Step 4: Hunt for Underpayments
Take your Payment Variance report. Export it to Excel. Filter out the contractual adjustments so you only see the “net expected” vs. “actual paid.” Sort by the largest dollar variance. Start your appeals process with the largest, most clear-cut underpayments.
Step 5: Create a “Payer Profile”
Based on your denial and underpayment analysis, create a one-page cheat sheet for each major payer. List their common denial reasons, their phone number for appeals, and any quirky rules they have. This turns individual knowledge into institutional knowledge.
Step 6: Close the Loop with Front-End Staff
This is critical. The data from your reports must inform your front-office processes. If denials show an issue with authorizations, you must retrain the staff who obtain them. The billing team’s reports are the quality assurance for the entire patient flow.
Step 7: Document, Track, and Repeat
Create a simple log where you track your findings each week: “Top 3 Denial Reasons,” “Largest Underpayment Recovered,” “A/R Over 90 Days Balance.” Tracking this over time shows you if your interventions are working and provides undeniable data for staff meetings.
Conclusion: Transform Your Reports from History Books into Crystal Balls
Your medical billing reports should not be a historical record of what went wrong. They are a dynamic, diagnostic tool that gives you the power to see the future of your revenue stream. By shifting from a reactive to a proactive, data-driven approach, you stop being a victim of collection gaps and start being the architect of your practice’s financial success. The 7-step framework above is your blueprint. Start this week. Run those reports not with dread, but with the curiosity of a detective. The lost revenue you recover might just be the key to your practice’s next phase of growth.
Your First Actionable Step: This week, don’t just “work the A/R.” Run your Payment Variance report for the first time. Pick your top payer and analyze just 20 paid claims. Compare what you were paid to your contracted rate. You will almost certainly find a discrepancy. That moment of discovery is the first step in closing your most costly collection gaps.